In this personal project,
I developed machine learning models to predict movie ratings based on various features.
The goal was to explore different regression techniques and assess their performance in predicting continuous target variables.

This project showcases the fusion of web scraping, sentiment analysis, and machine learning to extract meaningful insights from flight reviews.
The outcomes contribute not only to enhancing customer service but also to making informed decisions regarding booking behavior.
The journey continues as we refine models and explore new avenues for greater analytical depth.

The recommendation system project I developed utilizes collaborative filtering and natural language processing techniques to offer personalized book recommendations. By analyzing user interactions and book features, the system identifies similarities between books and suggests relevant titles based on individual preferences. Through a user-friendly interface built with Streamlit,
the application enhances the book discovery experience, allowing users to explore and discover new titles aligned with their unique tastes.
The Soma Bank ATM system offers users a secure and intuitive interface for seamless banking operations. With features such as account creation, PIN authentication, and real-time transaction updates, users can effortlessly deposit, withdraw, view balances, and transfer funds between accounts.
The clear menu structure ensures a user-friendly experience, making financial transactions quick and straightforward.
The Titanic Survival Prediction project leverages machine learning, employing the Random Forest Regressor and Classifier algorithms to analyze historical data and predict passenger survival outcomes.
By training on features such as age, class, and embarkation point, the models provide valuable insights into the factors influencing survival on the ill-fated Titanic voyage.
This project showcases the application of predictive modeling to understand and interpret historical events.
A data analysis project that examines the Olist platform's sales data and offers insights into revenue trends, order patterns, product categories, seller performance, consumer behavior, and payment methods is housed in this repository.
Python is used to carry out the project, together with Jupyter notebooks, and a number of data science packages.
By responding to some business queries, we hope to aid Olist in better understanding their e-commerce platform and maximizing their potential for growth
.

In the Educational App Analysis project, we conducted a comprehensive analysis of the features and functionalities for an upcoming web app in the education sector.
Through data-driven insights, we identified key user behaviors, preferences, and engagement patterns, informing the design and development process. This analysis serves as a strategic foundation, ensuring the educational app aligns with user needs and maximizes its impact on the learning experience.
The Advertising Sales Prediction project employs machine learning techniques, including Linear Regression, Decision Tree, and Gradient Boosting algorithms, to predict sales based on advertising spending in TV, radio, and newspapers. By analyzing the impact of different advertising channels, the project provides insights into the most effective mediums for maximizing sales.
This predictive modeling approach facilitates strategic decision-making for advertising campaigns, optimizing resource allocation across diverse channels.
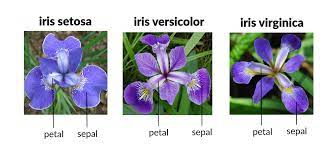
The Iris Flower Classification Prediction project utilizes machine learning techniques, including Logistic Regression, Support Vector Classifier (SVC), and Random Forest Classifier, to predict the species of Iris flowers based on features such as petal length, width, and sepal length.
These models collectively showcase different approaches to accurately categorize Iris flowers, demonstrating the versatility of machine learning in classifying diverse datasets.
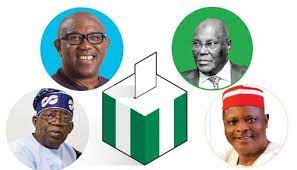
Using Python, I conducted a project on the 2023 Nigerian Presidential Election. I analyzed voter information and trends to create easy-to-understand graphs and charts.
The goal was to help people better understand how elections work and make informed decisions based on the data.